By: Hans_Wagner
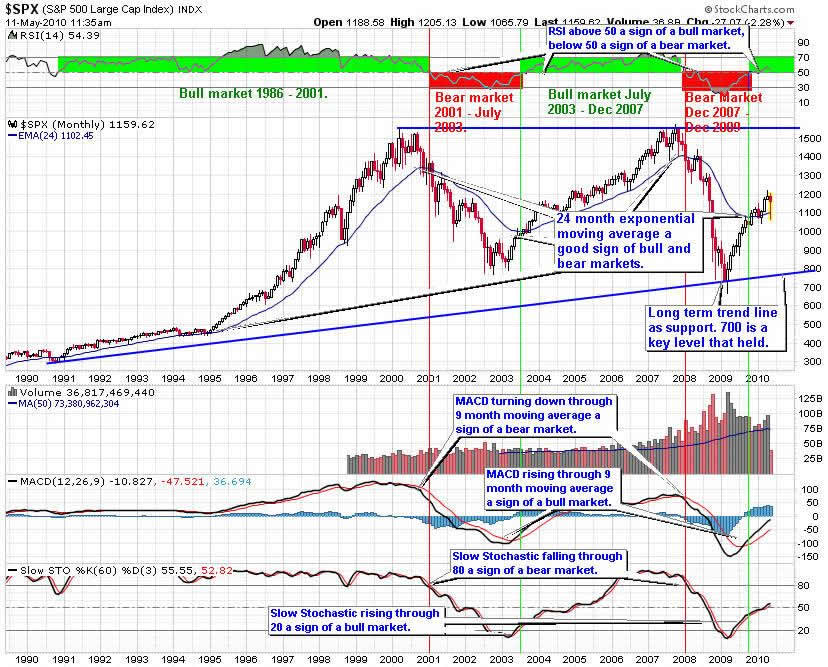
This is a monthly chart for the S&P 500 showing 20 years of performance. Since this index is the one used by professional traders, it is important to understand how it is performing. This chart is also excellent at defining the longer-term trends for the market. The bull market of the last five years broke down when the S&P 500 turned down through the 24-month exponential moving average. The bear market began when the index fell through the 24-month exponential moving average. Also, the RSI tested the 50 level, another important indicator of bear markets (if the RSI remains below 50 then we are in a bear market) and turned back down. The MACD crossing down through zero is another sign of the transition from bear market to bull market. Finally, the Slow Stochastic fell through 80 as another sign of the beginning of the bear market.
A stock market bottom forms when each of these indicators reverses and crosses through their signal lines. When the Slow Stochastic rises through the 20 level, we have one signal of a stock market bottom. The MACD climbing through its 9-month moving average is another. The RSI above 50 is another signal to follow for an end to a bear market. Finally, when the price crosses up through the 24-month moving average, we have another signal of end of the bear market.
In early May 2010, the market pulled back as it tests the breakout through the 24-month exponential moving average. The RSI is above 50 a sign of an up trend, though it is close to the 50 level. The MACD is trending up. Monitor how it handles the level to get an idea of the strength of this move. The Slow Stochastic is trending up as it pushes through the 50 level, a potential resistance area.
From a monthly chart perspective, the rally remains in tact as the 24-month EMA is still acting as support and the indicators have not turned negative.
For now, I intend to invest as though we are in a more normal market that will see rallies and then pull backs. The rally of the last 12 months came as a rebound from an oversold condition as investors feared the worse. Going forward, we will experience market rallies and pull backs as the economy struggles to expand. The overall trend will be sideways in a range of 900 on the low and 1,250 at the high.
Big Picture S&P 500
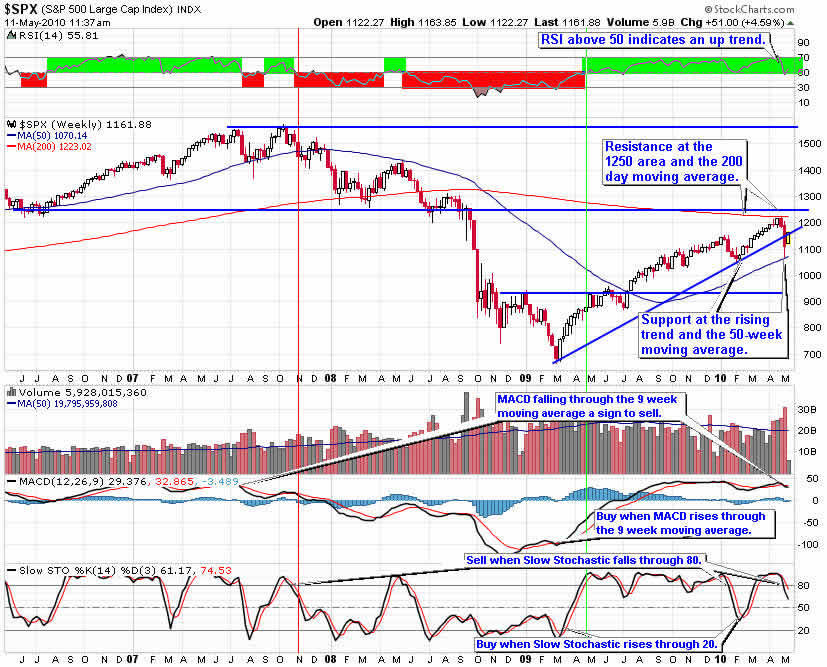
The rising trend that has been support since the rally started in March continues to hold indicating the market rally will continue. Monitor any retest to see if it holds. If it does, the rally will resume. If support fails, look for a pull back to the 50-week moving average.
RSI is above 50, a sign of an up trend. The MACD has reached a high point where it turned down through the 9-week moving average, giving a sell sign. The Slow Stochastic fell through 80, a sell sign.
The weekly chart pattern indicates the S&P 500 continues to trend up, though the indicators at high point it indicate we should see a pull back soon.
Monitor support of the rising trend. If it holds, it is a good buying opportunity. Otherwise, wait for the 50-week moving average to act as support.
S&P 500 Weekly Chart
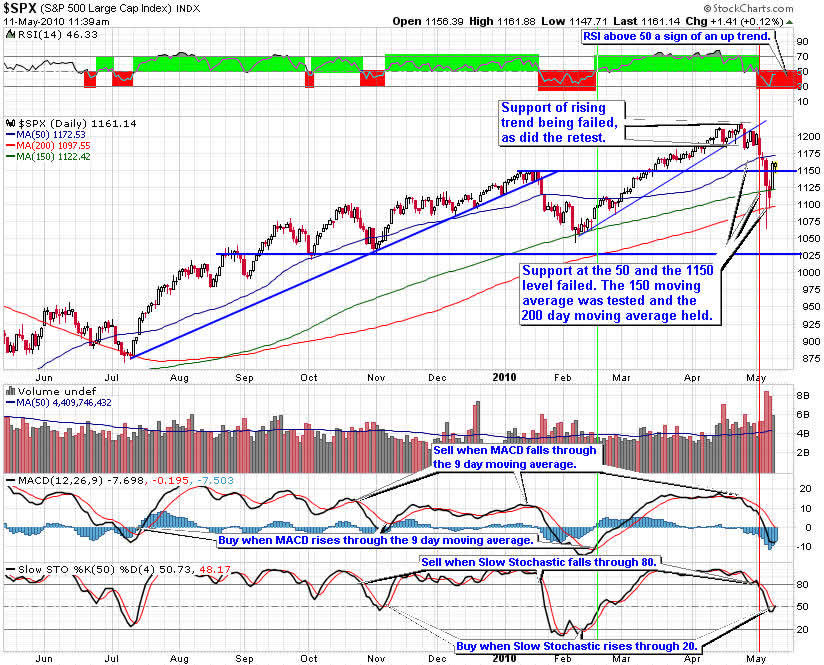
RSI is below 50 indicating a downtrend. The MACD turned down through the 9-day moving average, giving a sell sign. The Slow Stochastic fell through 80 giving a sell sign, though it might turn up at the zero level.
The daily chart of the S&P 500 is telling us the market is turning down after having fallen through the rising trend. Monitor whether the market can regain and hold the 1,150 area. The 50-day moving average will supply some resistance.
I am expecting the market to trade in a range for 2010 with the highs in the 1,250 area and lows in the 900 level.
Selecting the right sectors and stock picking will become more important to your success. Look to buy on dips in the market to important support levels. Then add down side protection at interim high points using trailing stops and protective put options to help improve the overall return. Covered calls options will also work well when the market is not rising as rapidly as the last nine months.
S&P 500 Daily Chart
The charts of the S&P 500 trend lines provide a good way for investors to align their portfolios with the overall market trends. Picking the right sectors and stocks will become even more important. Look to buy on dips in the price of the S&P 500 trend charts on the next pull back.
Be sure to use proper capital management techniques including trailing stops, protective put, covered call options and position sizing. When the pull back ends, look to add to long positions with stocks and ETFs from the sectors that are likely to outperform the overall market. Keep in mind, Warren Buffett's first rule of investing is to not lose money. Be patient waiting for good entry points.
By Hans Wagner
tradingonlinemarkets.com
No comments:
Post a Comment