Saturday, May 15, 2010

DJIA Intraday Analysis 14-05

Closed Buy breakout DJIA 10440/10.530/10.620 (trendline) target 10.810 (ex support), stop loss 30 p.
Profit:  +370p + 280p + 190p =840 points. Track record 6 Trades: (-65p-30p+370p + 280p + 190p-20p).

Hold Sell breakout 10.680 target 10.400 stop 30p, sell break 10.290 & breakout 10.200 target 10.000 stop 30p. Buy 9.900 stop 100p, target 10.800, buy breakout 10.840 target 11.000 stop 30p.


Friday, May 14, 2010

Robert Prechter's Stock Market Trend Forecast 2010 to 2016

By: EWI

The following article is excerpted from Robert Prechter's current issue of the Elliott Wave Theorist. For a limited time, you can Download the full 10-page issue, FREE.
By Robert Prechter, CMT
A Deadly Bearish Big Picture
As far as Elliott waves go, the rally since last March is totally normal. Two weeks off the low of March 2009, our Short Term Update published an upside target of Dow 10,000. So we knew a big rally was coming.
The August issue listed the range for typical retracement as being from 9368 to 11,620. This is a wide range, but there is nothing we can do about it; second waves have a lot of leeway. The illustration shown in that issue is reproduced below alongside an update of market prices. The Dow has so far stayed within the normal range."

Even so, I expected the rally to peak in the lower half of the target range then reverse. In August 2009, after 5 months, and in November, after 8 months, I was quite sure that the rally was ending. But instead of stopping near 10,000 at a 50% retracement, it has reached a 60% retracement. Whenever a market surprises me, I try to figure out why.
The Outlook From Time Cycles
For newer readers, I should reiterate that my view of time cycles is that they are very transient epiphenomena of the Wave Principle. This means that cycles are not the fundamental regulator for stock prices. They......... 
Robert Prechter, Chartered Market Technician, is the world's foremost expert on and proponent of the deflationary scenario. Prechter is the founder and CEO of Elliott Wave International, author of Wall Street best-sellers Conquer the Crash and Elliott Wave Principle and editor of The Elliott Wave Theorist monthly market letter since 1979.

S&P 500 Stock Market Trends Forecast for May 2010


This is a monthly chart for the S&P 500 showing 20 years of performance. Since this index is the one used by professional traders, it is important to understand how it is performing. This chart is also excellent at defining the longer-term trends for the market. The bull market of the last five years broke down when the S&P 500 turned down through the 24-month exponential moving average. The bear market began when the index fell through the 24-month exponential moving average. Also, the RSI tested the 50 level, another important indicator of bear markets (if the RSI remains below 50 then we are in a bear market) and turned back down. The MACD crossing down through zero is another sign of the transition from bear market to bull market. Finally, the Slow Stochastic fell through 80 as another sign of the beginning of the bear market.
A stock market bottom forms when each of these indicators reverses and crosses through their signal lines. When the Slow Stochastic rises through the 20 level, we have one signal of a stock market bottom. The MACD climbing through its 9-month moving average is another. The RSI above 50 is another signal to follow for an end to a bear market. Finally, when the price crosses up through the 24-month moving average, we have another signal of end of the bear market.
In early May 2010, the market pulled back as it tests the breakout through the 24-month exponential moving average. The RSI is above 50 a sign of an up trend, though it is close to the 50 level. The MACD is trending up. Monitor how it handles the level to get an idea of the strength of this move. The Slow Stochastic is trending up as it pushes through the 50 level, a potential resistance area.
From a monthly chart perspective, the rally remains in tact as the 24-month EMA is still acting as support and the indicators have not turned negative.
For now, I intend to invest as though we are in a more normal market that will see rallies and then pull backs. The rally of the last 12 months came as a rebound from an oversold condition as investors feared the worse. Going forward, we will experience market rallies and pull backs as the economy struggles to expand. The overall trend will be sideways in a range of 900 on the low and 1,250 at the high.
Big Picture S&P 500
The four-year weekly S&P 500 trend chart shows that the market continues to rise, with the rising trend and especially the 50-week moving average providing support.  The next resistance level is the 1,250 area or the 200-week moving average.
The rising trend that has been support since the rally started in March continues to hold indicating the market rally will continue. Monitor any retest to see if it holds. If it does, the rally will resume. If support fails, look for a pull back to the 50-week moving average.
RSI is above 50, a sign of an up trend. The MACD has reached a high point where it turned down through the 9-week moving average, giving a sell sign. The Slow Stochastic fell through 80, a sell sign.
The weekly chart pattern indicates the S&P 500 continues to trend up, though the indicators at high point it indicate we should see a pull back soon.
Monitor support of the rising trend. If it holds, it is a good buying opportunity. Otherwise, wait for the 50-week moving average to act as support.
S&P 500 Weekly Chart
On the daily chart of the S&P, the index broke through support of the rising trend, the 50-day moving average and the 1,150 level. The 150-day and the 200-day moving averages are holding as support.
RSI is below 50 indicating a downtrend. The MACD turned down through the 9-day moving average, giving a sell sign. The Slow Stochastic fell through 80 giving a sell sign, though it might turn up at the zero level.
The daily chart of the S&P 500 is telling us the market is turning down after having fallen through the rising trend. Monitor whether the market can regain and hold the 1,150 area. The 50-day moving average will supply some resistance.
I am expecting the market to trade in a range for 2010 with the highs in the 1,250 area and lows in the 900 level.
Selecting the right sectors and stock picking will become more important to your success. Look to buy on dips in the market to important support levels. Then add down side protection at interim high points using trailing stops and protective put options to help improve the overall return. Covered calls options will also work well when the market is not rising as rapidly as the last nine months.
S&P 500 Daily Chart
Given this analysis of the S&P 500 trend line charts, it is important to position your portfolio for a market that is more likely to trend in a range with cyclical rallies and pullbacks.
The charts of the S&P 500 trend lines provide a good way for investors to align their portfolios with the overall market trends. Picking the right sectors and stocks will become even more important. Look to buy on dips in the price of the S&P 500 trend charts on the next pull back.
Be sure to use proper capital management techniques including trailing stops, protective put, covered call options and position sizing. When the pull back ends, look to add to long positions with stocks and ETFs from the sectors that are likely to outperform the overall market. Keep in mind, Warren Buffett's first rule of investing is to not lose money. Be patient waiting for good entry points.
By Hans Wagner
tradingonlinemarkets.com

Update Daily Investment News

Rupiah to Slip 1.6% as Resistance Holds: Technical Analysis
(Bloomberg) -- Indonesia’s rupiah may decline 1.6 percent in a week after failing to appreciate beyond its 20-day moving average, repeating a pattern that occurred in February, according to Sumitomo Mitsui Banking Corp.
http://www.bloomberg.com/apps/news?pid=newsarchive&sid=aEJ6aRqUh8ms

Lippo Karawaci Completes Exchange of 2011 Notes for 2015 Notes
(Bloomberg) -- PT Lippo Karawaci, Indonesia’s biggest publicly traded real estate developer, said it completed an exchange offer of its notes due 2011 for new notes due 2015.
http://www.bloomberg.com/apps/news?pid=newsarchive&sid=arGUo6a3KnwQ

Gudang, SK C&C, China Life Surge on MSCI Inclusion (Update1)
(Bloomberg) -- Gudang Garam, Indonesia’s second- largest cigarette maker, and SK C&C Co., rose to a record while China Life Insurance Co. climbed in Taiwan after MSCI Inc. said the companies will be added to its benchmark indexes.
http://www.bloomberg.com/apps/news?pid=newsarchive&sid=afagK4b0InuA

Another 'Freefall' to Push Dow Below 5000: Strategist
The CBOE volatility index, widely considered the best gauge of fear in the market, is trading above 25 Thursday. Is this volatility good for the market? James Hardesty, president, market strategist and chief economist at Hardesty Capital Management and David Hefty, CEO of Cornerstone Wealth Management shared their insights.
http://www.cnbc.com/id/37126552

Euro Breakup Talk Increases as Germany Loses Its Currency Proxy
(Bloomberg) -- Romano Prodi recalls how he persuaded Germany to allow debt-swamped Italy into the euro: support our membership and we’ll buy your milk, he said.
http://www.bloomberg.com/apps/news?pid=20601087&sid=agwHp5N5FXA8&pos=2

Loonie May Rise to 19-Month High Versus Yen: Technical Analysis
(Bloomberg) -- Canada’s dollar may rise to a 19- month high against the yen after a downward trend halted, said Gaitame.Com Research Institute Ltd., a unit of Japan’s largest foreign-exchange margin company.
http://www.bloomberg.com/apps/news?pid=newsarchive&sid=aM3fvT_S4x2I

S&P 500 May Surpass April High After Rout: Technical Analysis
(Bloomberg) -- The Standard & Poor’s 500 Index is likely to rise to new highs for 2010 after last week’s rout removed “excessive bullishness” without pushing the benchmark below a key level, according to Bay Crest Partners LLP.
http://www.bloomberg.com/apps/news?pid=newsarchive&sid=ayho6OSDM9tg

Silver May Rise to $21.355, Barclays Says: Technical Analysis
(Bloomberg) -- Silver, trading near a two-year high, may climb about 10 percent to $21.355 an ounce, according to technical analysis by Barclays Capital.
http://www.bloomberg.com/apps/news?pid=newsarchive&sid=aPjfvMijsfCU

DeGraaf Says Trend for Stocks Is ‘Positive’: Technical Analysis
(Bloomberg) -- The rally in U.S. equities is likely to resume following the biggest weekly decline in 14 months, said Jeffrey deGraaf, the top-ranked technical analyst.
http://www.bloomberg.com/apps/news?pid=newsarchive&sid=aR_JMwNwAgp8

Loonie Will Return to Parity, Citi Says: Technical Analysis
(Bloomberg) -- The Canadian dollar will likely return to parity after the greenback fell below support in the range of C$1.0207 to C$1.0225, according to Citigroup Inc.
http://www.bloomberg.com/apps/news?pid=newsarchive&sid=aNMsqhIfL2fU

Asian Currencies Gain This Week as Data Points to Faster Growth
(Bloomberg) -- Asian currencies appreciated this week, led by Malaysia’s ringgit and South Korea’s won, on signs the region’s economic growth is gathering pace, bolstering demand for emerging-market assets.
http://www.bloomberg.com/apps/news?pid=newsarchive&sid=ae07f5QmTd.w

Mobius Says China Bear Market Offers Opportunities (Update1)
(Bloomberg) -- Chinese stocks are becoming more attractive after initial share sales and derivative trading pushed the benchmark index to a bear market, investor Mark Mobius said.
http://www.bloomberg.com/apps/news?pid=newsarchive&sid=aDf0LPzr_6iQ

IMF Urges Nations to Reduce Debt, Says Risk ‘Cannot Be Ignored’
(Bloomberg) -- The International Monetary Fund urged governments to cut public debt to prevent higher interest rates and slower economic growth, saying the fiscal crisis in Europe shows such risk “cannot be ignored.”
http://www.bloomberg.com/apps/news?pid=newsarchive&sid=aExw47Q5ncKg

Oil Is Poised for Second Weekly Drop on Bets Demand Will Slow
(Bloomberg) -- Crude oil is poised for a second weekly decline amid speculation Europe’s sovereign-debt crisis and rising supplies in the U.S., the world’s biggest energy consumer, signaled global fuel demand will be slow to recover.
http://www.bloomberg.com/apps/news?pid=newsarchive&sid=aa.TSRKwVLH8

Palladium May Reach $700 in Six Months, Matthey Says (Update1)
(Bloomberg) -- Palladium may rise to a nine-year high in the next six months and platinum may climb to the highest price since July 2008 on stronger industrial usage and investment demand, Johnson Matthey Plc said.
http://www.bloomberg.com/apps/news?pid=newsarchive&sid=aVR_i5bHKiSY

S&P 500 Annual Meeting Calendar, Week of May 17 - June 11
(Bloomberg) -- The following table shows when companies in the Standard & Poor's 500 Index are scheduled to hold their annual meeting. Data is compiled by Bloomberg through company releases, stock exchanges and filings reported with the Securities and Exchange Commission.
http://www.bloomberg.com/apps/news?pid=newsarchive&sid=auaKIFaQu6sQ

Thai Stocks May Rally 16% This Year, Asia Plus Says (Update1)
(Bloomberg) -- Thailand’s stock index, Asia’s third- best performer in the past month, may rally a further 16 percent this year as political tension eases and economic growth boosts corporate earnings, Asia Plus Securities Pcl said.
http://www.bloomberg.com/apps/news?pid=newsarchive&sid=a32oVGwiRHcQ

With Banks Under Fire, Some Expect a Settlement
It is starting to feel as if everyone on Wall Street is under investigation by someone for something.
http://www.cnbc.com/id/37149251

Time for Regulators to Impose Order in the Markets
If your machine makes a mistake that the dumbest human would never make, then maybe you don’t have a very good machine.
http://www.cnbc.com/id/37149676

White House's Volcker: Future of Euro in Doubt
Europe's debt troubles could undermine its currency, White House Economic Adviser Paul Volcker said on Thursday.
http://www.cnbc.com/id/37144724

Charts: Look for S&P 500 Support at 1,132
The S&P 500 will fall toward 1,132 points in the next two or three sessions and then start a "large sideways movement," Bill McLaren, independent trader, told CNBC Friday.
http://www.cnbc.com/id/37146867

One Market Relationship Is My 'Biggest Concern': Art Hogan
Stocks slid on Friday amid a fresh round of worries about the U.S. economic recovery. How should investors prepare their portfolios and what should they watch for? Art Hogan, global equity product director at Jefferies, shared his insights.
http://www.cnbc.com/id/37149052

Gold to Fall Below $1,000 By End of Year: Economist
Strength in the US dollar and stability from the European bailout will take the steam out of gold's recent run and send prices to below $1,000 by year's end, one economics firm says.
http://www.cnbc.com/id/37128062

'Carthaginian Peace' Could Be Bad for Gold: Strategist
Carthaginian peace refers to the imposition of a very brutal “peace,” or the armistice imposed on Carthage by Rome that saw the Romans systematically burn Carthage to the ground.
http://www.cnbc.com/id/37126503

Thursday, May 13, 2010

Elliott Waves. EWI

Prechter Describes The "Stunning Long-Term Elliott Wave Picture"
The past doesn't "define" the present or the future, but it sure does provide context

Please join me to consider a time in the stock market that lasted just under three years: 32 months, to be precise. During this period a series of powerful rallies stand out clearly on a price chart. The shortest of these rallies was four weeks, the longest more than five months.
http://www.elliottwave.com/freeupdates/archives/2010/05/11/Prechter-Describes-The--Stunning-Long-Term-Elliott-Wave-Picture-.aspx


Watching a Wave; Protecting a Nest Egg
Almost no one tells you about another "financial tsunami" that's likely on its way.
If you're a passenger on a ship in the middle of the ocean, you can't detect a tsunami -- the wave heights are too short to distinguish them from regular open ocean waves. (But wave lengths can be hundreds of miles long.) Only when this energy reaches shallower waters does the mammoth tsunami wall form -- and washes away all that's in the way. So when forecasters warn "Move to higher ground!" it's not wise to think, "I won't believe a tsunami is coming until I see it." You won't until it's too late.
http://www.elliottwave.com/freeupdates/archives/2010/05/10/Watching-a-Wave-Protecting-a-Nest-Egg.aspx

EUR/USD: First Up, Then Down
http://www.elliottwave.com/freeupdates/archives/2010/05/10/EUR/USD-First-Up%2C-Then-Down.aspx

Wednesday, May 12, 2010

Rekomendasi & Strategy Top 26 Saham & IHSG

IHSG masih berada dalam trend bearish selama bertahan di bawah 2.850 (fibo 50% 2.996-2705) dalam pola broadening tops dan masih diatas 100 & 200 day MA.  Buy on weakness:  B7; bmri, pgas, medc, bbri, tlkm, smra, bksl, asii, unvr, bhit, mncn, ggrm, tmpi, dild, ctra, bsde, sgro, untr, klbf. Risk 3.5%, Reward >10%. Buy 2.790 target 2.880, trailing stop 20p, sell breakout 2.765 target 2.710 stop 20p.
Track Record IHSG: 27 Recommendations (21 profits: 2 break even: 4 loss) = (+20p+45p+73p+53+60p+45p+63p+0p+27p+50p-20p+13p+40p+45p+40p+29p-30p-154p-75p+80p+26p+0p+28p+80p). Total : 847 point - 259 point = Net +588 points = Average 21.77 point.


Tuesday, May 11, 2010

IHSG is start in correction wave zig zag micro abc in b/B??? (See Buy Signal)

Buy 2.795 target 2.885 stop 20p, Sell 2.880 target 2.800 stop 20p, sell breakout 2.766 target 2.705 stop 20p, sell breakout 2.695 target 2.640 stop 20p. 
Closed Buy 2.823 target 2.880 trailing stop 30p. Profit +30p
Track Record IHSG: 27 Recommendations (21 profits: 2 break even: 4 loss) = (+20p+45p+73p+53+60p+45p+63p+0p+27p+50p-20p+13p
+40p+45p+40p+29p-30p-154p-75p+
80p+26p+0p+28p
+80p). Total : 847 point - 259 point = Net +588 points = Average 21.77 point.
Intraday Hint: 13.55 WIB After hit low 2.812 today.

DJIA Intraday Analysis (Revision)

Closed Buy breakout DJIA 10440/10.530/10.620 (trendline) target 10.810 (ex support), stop loss 30 p.
Profit:  +370p + 280p + 190p =840 points
Sell breakout 10.680 target 10.400 stop 30p, sell break 10.290 & breakout 10.200 target 10.000 stop 30p. Buy 9.900 stop 100p, target 10.800, buy breakout 10.840 target 11.000 stop 30p.

Update Daily Investment News

Indeks Harga Saham Gabungan (IHSG) dan nilai tukar rupiah dibuka kompak melemah. Tekanan jual pada saham-saham BUMN membuat IHSG melawan arus bursa regional yang masih menguat dan bergerak di zona negatif. Pada perdagangan Selasa (11/5/2010), IHSG dibuka naik tipis ke level 2.850,823 dan langsung menguat ke level 2.862,336, naik 12 poin dibanding penutupan kemarin di level 2.850,427. Saat ini IHSG berada di 2.830 (-20 poin). Namun Indeks LQ 45 juga melemah tipis 0,233 poin (0,04%) ke level 549,186.

PT Indo Tambangraya Megah Tbk (ITMG) mencatat penurunan laba bersih triwulan I-2010 sebesar 34,00% akibat peningkatan harga pokok penjualan sebesar 33,17% ditengah kenaikan penjualan yang hanya sebesar 17,44%.

Tunggu Harga BHIT Maksimal, Baru Keluar
Investor disarankan mencermati saham PT Bhakti Investama (BHIT), terutama menjelang perdagangan saham bonus pada 21 Mei 2010 mendatang.

Keluarnya laporan keuangan kuartal pertama yang cukup memuaskan, membawa ekspektasi pada kinerja emiten sepanjang 2010. Bagaimana penerawangan para analis?
Pengamat pasar modal Willy Sanjaya menjagokan tiga emiten untuk 2010 yakni PT International Nickel Indonesia (INCO), PT Bumi Resources (BUMI) dan PT Energi Mega Persada (ENRG). Hal ini terkait kinerja tiga bulan pertama yang cukup menarik.
Adapun Janson Nasrial, pengamat pasar modal dari AmCapital Indonesia menjagokan sektor telekomunikasi untuk tahun ini, dengan saham-sahamnya PT Telkom (TLKM) dan PT XL Axiata (EXCL).

Economic: PDB 1Q10 Tumbuh 5,7%
Laju pertumbuhan ekonomi 1Q10 sebesar 5,7%, dibandingkan dengan periode yang sama tahun lalu, diyakini sebagai awal yang bagus untuk mencapai target pertumbuhan tahun ini. Menteri Keuangan mengatakan realisasi pertumbuhan ekonomi cenderung meningkat pada kuartal berikutnya. Untuk pertumbuhan ekonomi pada 2Q10, Sri Mulyani menyebutkan pemerintah telah menyiapkan berbagai antisipasi yang sudah ada di dalam kerangka kerja APBN 2010.

    * INTA: Bidik Rights Issue Rp500 M
    * TGKA: Bagi Dividen Rp35,8 Miliar
    * SMCB: Proyek Holcim di Nusakambangan Dievaluasi
    * ISAT: Jumlah Pelanggan Naik 17,6%
    * CTRP: Siapkan Capex Rp800 Miliar
    * CPRO: Dapat Pinaman BNI Rp170 Miliar
    * BMRI: Riswinandi Calon Kuat Wadirut Bank Mandiri

Saham PT Bhakti Investama (BHIT) kabarnya bakal dikerek ke level Rp400-500 untuk jangka pendek maupun menengah. Proyeksi kenaikan harga sahame tersebut terkait rencana BHIT yang bakal menerbitkan obligasi konversi pada harga Rp412,5 dalam waktu dekat. Selain itu, rencana perseroan membagikan saham bonus ikut memcau kenaikan BHIT. Total saham yang diperdagangkan sebanyak 84,43 juta lembar senilai Rp25,38 miliar.

Konsorsium broker diberitakan bakal mengerek saham PT Royal Oak Development Asia Tbk (RODA) menembus level Rp100.Proyeksi kenaikan harga saham RODA juga terkait kabar perseroan yang tengah mengkaji untuk masuk ke dalam bisnis pertambangan. Selain itu, kemungkinan perseroan menambah modal dengan menerbitkan saham baru (right issue) turut menopang kemungkinan naiknya harga saham RODA.

PT Bank Windu Kentjana International Tbk (MCOR) berencana menggelar penerbitan saham baru dengan hak memesan efek terlebih dahulu (HMETD) alias rights issue sebesar Rp 202,926 miliar. Harga rights issue ditetapkan sebesar Rp 200 per saham.

PT Bank Tabungan Pensiunan Nasional Tbk (BPTN) menambah nilai obligasi yang akan mereka terbitkan, dari Rp 750 miliar menjadi Rp 1,3 triliun. Proses penerbitan obligasi sudah dalam tahap final dan ditargetkan bakal dicatatkan di Bursa Efek Indonesia (BEI) pada 19 Mei 2010.

Sebuah operator telekomunikasi terkemuka di Indonesia, PT Indosat Tbk (ISAT) segera meluncurkan global bond sebesar US$500 juta. Penawaran ini awalnya akan menguji selera investor global.

INTA Beri Dividen Rp 30 Perlembar Saham
PT Intraco Penta Tbk (INTA) memutuskan memberi dividen tahun buku 2009 sebesar Rp 30 per lembar saham

Sumber: Bloomberg, inilah.com, kontan, detikfinance.com

Indonesia Stocks May Gain 20% to Record, Batavia Aset Says
(Bloomberg) -- Indonesia’s benchmark stock index, the best performer in Asia’s 10 biggest markets, may rise a further 20 percent to a record this year on faster economic growth, the nation’s top performing fund said.
http://www.bloomberg.com/apps/news?pid=newsarchive&sid=arB8jS7WWw5k

Indonesia Trims Sukuk, Samurai Debt-Sale Plans, Waluyanto Says
(Bloomberg) -- Indonesia trimmed the size of its planned sales of Islamic and yen-denominated debt because of concern that Greece’s debt crisis will spread in Europe, an Indonesian finance ministry official said.      “We will only the sell at benchmark size,” Rahmat Waluyanto, director general of the debt management office, said in a telephone interview in Jakarta. A benchmark sale typically means $500 million
http://www.bloomberg.com/apps/news?pid=newsarchive&sid=a0W1Tjjbb_b8

Goldman Says Buy Ringgit, Peso, Rupiah Against Yen (Update1)
(Bloomberg) -- Goldman Sachs Group Inc. recommended buying a basket of Asian currencies against the yen, saying there is “little obvious contagion” risk from Europe’s debt crisis.
http://www.bloomberg.com/apps/news?pid=newsarchive&sid=aJSDFtfyF930

Euro Is ‘Oversold,’ May Rally to $1.3115: Technical Analysis
(Bloomberg) -- The euro is “oversold” and may rally toward a two-week high against the dollar, Forecast Pte said, citing trading patterns.
http://www.bloomberg.com/apps/news?pid=newsarchive&sid=aMEwE04NB4pw

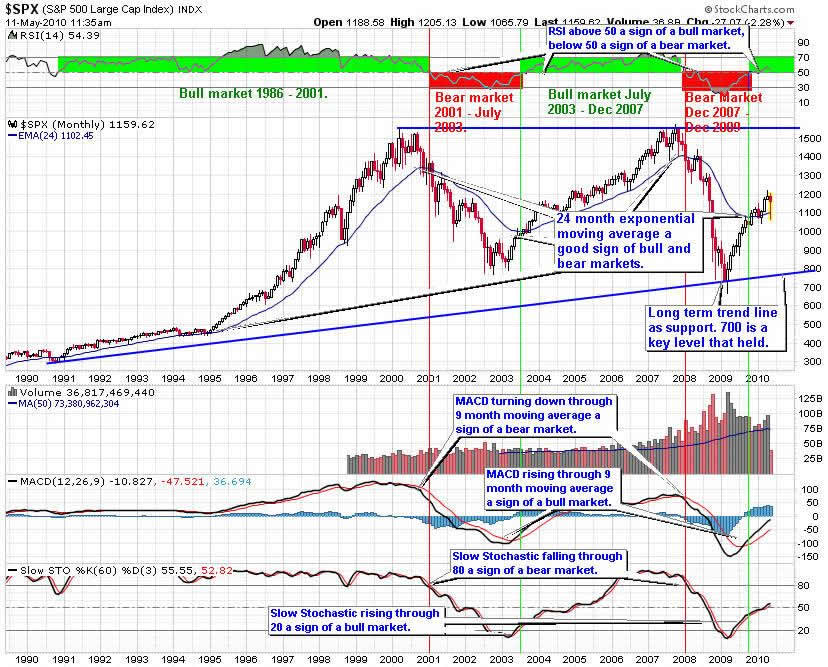
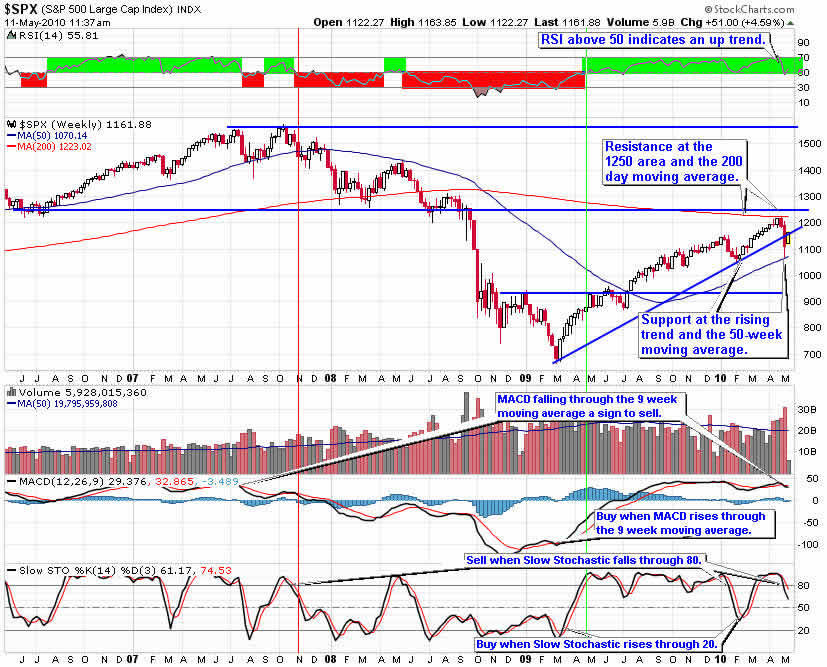
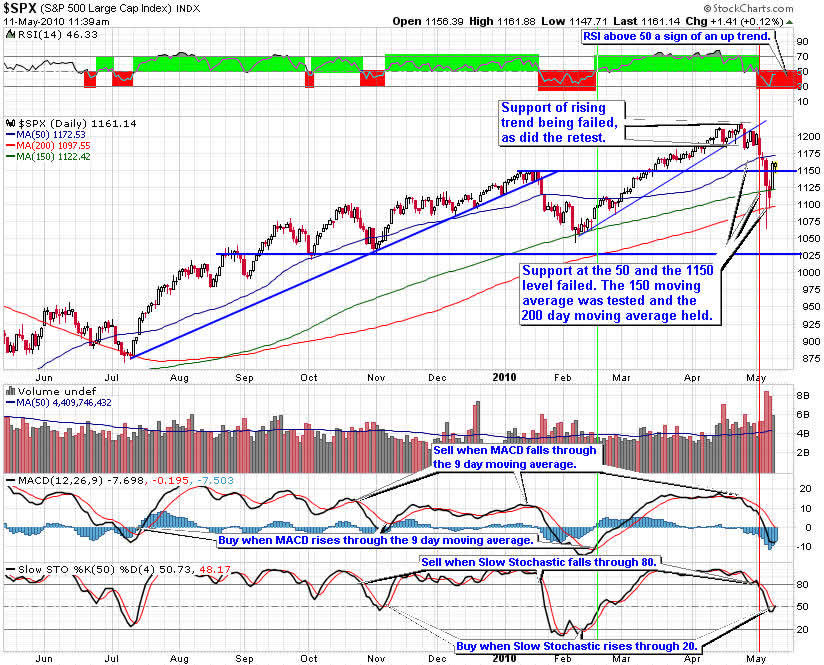
S&P 500 May Retreat 19% by Third Quarter: Technical Analysis
(Bloomberg) -- The Standard & Poor’s 500 Index may fall a further 19 percent to the lowest level since July after plummeting the most in 14 months last week, according to a technical analyst at Thinktrading.com.
http://www.bloomberg.com/apps/news?pid=newsarchive&sid=aVOuhQU9HgsI

Euro May Test May 6 Low as Market Fills Gap: Technical Analysis
(Bloomberg) -- The euro may fall below last week’s low after filling in the gap between Friday’s high and today’s open that occurred after Europe announced an aid package of almost $1 trillion for the region’s most indebted nations.
http://www.bloomberg.com/apps/news?pid=newsarchive&sid=arg4uX6vfKWQ

Treasuries Will Drop After Two-Week Rally: Technical Analysis
(Bloomberg) -- Treasuries are poised to fall over the next one to two weeks after a rally led to the biggest two- week drop in 10-year yields since December 2008, according to Royal Bank of Scotland Group Plc. 
http://www.bloomberg.com/apps/news?pid=newsarchive&sid=a_iOPGaU_a30

Commodity Slump a ‘Buying Opportunity,’ Goldman Says (Update1)
(Bloomberg) -- The slump in commodity prices last week created a “buying opportunity” because economies are improving, Goldman Sachs Group Inc. said.
http://www.bloomberg.com/apps/news?pid=newsarchive&sid=aVzv34fAMi3s

Biggs Says U.S. Stocks May Surge 20%, Led by Technology Shares
(Bloomberg) -- U.S. stocks could jump as much as 20 percent, led by technology companies, as the global economy rebounds from Europe’s debt crisis, said Barton Biggs.
http://www.bloomberg.com/apps/news?pid=newsarchive&sid=ajiFzOknCrOc

European Stocks Upgraded to ‘Overweight’ at Morgan Stanley
(Bloomberg) -- European stocks were upgraded to “overweight” from “underweight” by strategists at Morgan Stanley.
http://www.bloomberg.com/apps/news?pid=newsarchive&sid=a6_hw01RSOlk

What the Euro Rescue Means for Investors
The markets aggressively and repeatedly asked the question, 'Do You Want To Save The Euro?'
http://www.cnbc.com/id/37069367

Poll: Time to Buy, Sell or Hold?
May has been a turbulent month for the market, and I'd like to hear what you think.
http://www.cnbc.com/id/37074867

Was Monday’s Rally Just A Head Fake?
Stocks  racked up their best one-day gain in over a year on Monday after word of a $1 trillion emergency rescue package from the EU quelled fears that a new credit crisis would derail the global recovery.
http://www.cnbc.com/id/37064610

Investors Hurt by Stock Freefall May Have to Live With Losses
Investors caught on the wrong side of trades in last week's market freefall may have to live with their losses.
http://www.cnbc.com/id/37071046

EU Rescue Relief Will Be Short-Lived: Analysts
Having watched the Greek debt crisis rattle global investors European Union leaders, the International Monetary Fund and, crucially, the European Central Bank on Sunday unveiled a €720 billion ($936 Billion) emergency rescue package to help stabilize markets and prevent the break-up of the euro.
http://www.cnbc.com/id/37058212

Daily Forex and Dow Jones Recommended Levels
by Nikolajs Serikovs FXtechtrade 
Several words about the EUR/USD future.
Resistance (daily close) :  1.3182, 1.3364, 1.3590 and 1.3778. After that 1.3958, 1.4186 and 1.4400. Break of the latter will give  1.4490, 1.4692 и 1.4884. Then 1.5117, 1.5386, 1.5592 и 1.5660. Break of 1.5660 would lead to  1.5865, 1.7280 и 1.9430(published on 23.10.2008).
Support (daily close) : 1.2610, 1.2428 and 1.2246. Then 1.2128, 1.1970, 1.1838 and 1.1700. Break of the latter would give 1.1533, 1.1352 and 1.1181(published оn 23.10.2008).
Dow Jones :
Resistance(daily close) : 9382.12, 9744.26, 10 091.30, 10 935.23, 11 164.57, 11 344.92 and 11 520.30. Then 11 749.22, 11 970.00, 12 152.82, 12 600.24, 12 982.20, 13 162.50 and 13 320.00.   Break of the latter will lead to 13 567.60, 13 668.74 and 13 792.53 (published on October 21, 2008).
Support (daily close):  9630.33 and 9358.35(main), 9090.00, 8912.62 (published on November 10, 2009).
Light Crude :
Support (daily close): 39.36, 34.88, 31.28, 23.17, 19.57, 15.10, 11.70, 9.64, 8.11 and 6.98(published on December 07, 2008).
Resistance(daily close): 95.73, 98.21, 99.45, 101.48 and 102.27 (published on October 30, 2007). Next levels 103.73, 105.32, 106.54, 109.35, 112.56 and 117.28. Then follow 121.50, 124.03 and 126.56(added on February 29, 2008). Continuation will bring 132.73, 135.08, 139.92, 141.46 and 144.00( added on May 12, 2008).
Next levels : 149.06, 151.88, 154.13, 157.36, 159.46, 162.00, 169.87 and 172.13(added on July 04, 2008).
EUR/USD
Today’s support: - 1.2761 and 1.2735(main), where correction is possible. Break would give  1.2693, where correction also may be. Then follows 1.2651. Break of the latter would result in 1.2623. If a strong impulse, we would see 1.2600. Continuation will give  1.2541. 
Today’s resistance:  - 1.2874, 1.2928 and 1.2967(main). Break would give 1.2988, where a correction is possible. Then goes 1.3006. Break of the latter would result in 1.3032. If a strong impulse, we’d see  1.3061. Continuation will give 1.3095.
USD/JPY
Today’s support: - 92.63, 92.14 and 91.80(main). Break would bring 91.58, where correction is possible. Then 91.34, where a correction may also happen. Break of the latter will give 90.79. If a strong impulse, we would see 90.37. Continuation would give 90.05.
Today’s resistance: - 93.66(main), where a correction may happen. Break would bring 94.15, where also a correction may be. Then 94.40. If a strong impulse, we would see 94.68. Continuation will give 95.11.
DOW JONES INDEX
Today’s support: - 10632.25 and 10574.30(main), where a delay and correction may happen. Break of the latter will give 10533.40, where correction also can be. Then follows 10459.50.  Be there a strong impulse, we shall see 10417.50. Continuation will bring  10351.16.
Today’s resistance: - 10856.45(main), where a delay and correction may happen. Break would bring 10891.38, where a correction may happen. Then follows 10932.37, where a delay and correction could also be. Be there a strong impulse, we’d see 10956.60. Continuation would bring 11009.12 and 11034.26.

CLSA - Feng Shui Index 2010

http://www.ziddu.com/download/9811228/FengShuiIndex2010YearoftheGoldenTiger.pdf.html

UBS Forecasts Victory for Brazil in 2010 Soccer World Cup

(Bloomberg) -- UBS Wealth Management Research, which correctly predicted Italy would win the 2006 soccer World Cup, says Brazil will triumph this year in South Africa.“Our forecast is based on in-depth quantitative analysis that places great emphasis on a country’s previous performance at World Cup tournaments,” the UBS unit said in an e-mailed statement.
http://www.bloomberg.com/apps/news?sid=aGBaMylLXtvQ&pid=20601087

Rekomendasi & Strategy Top 24 Saham & IHSG

Hold Buy 2.823 target 2.880 trailing stop 30p. Buy 2700/2.720, closed at 2.790 for +80 point.
Buy breakout 2.823 target 2.880, stop 20p
IHSG menunjukkan signal bull continuation dari pola candle long opening marubozu dalam broadening tops, untuk target 2.880/2.910 (koreksi 10% dari record high) untuk mengantisiasi wave kemungkinan iii/c dalam B, selama tidak ditutup dibawah 2822, jika tembus target 2773. Sell on rally: B7; pgas, medc, bbri, tlkm, smra, bksl, asii, unvr, bhit, bmtr, ggrm, doid, dild, smar, hmsp, bsde, ctra. Risk 3.5%, Reward >10%. Hold Buy 2.823 target 2.880/2.900, trailing stop 20p.
Track Record IHSG: 26 Recommendations (20 profits: 2 break even: 4 loss) = (+20p+45p+73p+53+60p+45p+63p+0p+27p+50p-20p+13p
+40p+45p+40p+29p-30p-154p-75p+
80p+26p+0p+28p
+80p). Total : 817 point - 259 point = Net +558 points = Average 21.46 point.

Research Valbury Weekly 10-05: http://www.ziddu.com/download/9811095/Valburyweekly.pdf.html 
Research BIRD Weekly 10-14: http://www.ziddu.com/download/9811132/BWMay10-142010.pdf.html


Monday, May 10, 2010

DJIA Intraday Analysis (Revision)

Buy breakout DJIA 10440/10.530/10.620 (trendline) target 10.810 (ex support), stop loss 30 p.

Update Daily Investment News

Indeks Harga Saham Gabungan (IHSG) dibuka menguat 56 poin seiring tren penguatan seluruh bursa Asia setelah IMF menyepakati pinjaman EUR 30 miliar ke Yunani. Nilai tukar rupiah juga menguat ke level 9.150/US$. Pada perdagangan Senin (10/5/2010), IHSG dibuka naik tipis ke level 2.739,927 dan langsung menguat ke level 2.795,402, naik 56 poin dibanding penutupan akhir pekan lalu di level 2.739,333. Indeks LQ 45 juga menguat 12,268 poin (2,33%) ke level 537,638.

    * MPPA: Cetak Laba Rp 38,11 M di Triwulan I-2010
    * BLTA: Berlian Laju Cari Utang Untuk Akuisisi
    * BMRI: BSM Gunakan Tambahan Modal
    * SMCB: Produsen Semen Mulai Fokus ke Luar Jawa
    * MEDC: Medco-Libia Investasi US$321 Juta
    * TMPI: Dapat Tambahan Dana Dari GEM Rp450 Miliar
    * MASA: Raih Utang US$175 Juta
    * BLTA: Berlian Laju Cari Utang Untuk Akuisisi
    * IPO: IPO Nippon Indosari Segera Efektif

PT Bank International Indonesia Tbk (BII) dikabarkan bakal meningkatkan kepemilikan saham di PT Wahana Ottomitra Mulitartha Tbk (WOMF) dari 50,03% menjadi di atas 90%. Konon, BII mau menguasai mayoritas saham WOMF seperti dilakukan PT Bank Dananom Tbk (BDMN) terhadap PT Aldira Dinamika Multifinance Tbk (ADMF) sebanyak 95,5%.

Saham PT Intiland Developmnet Tbk (DILD) kabarbnya bakal dikerek ke level Rp1.500 karena perseroan telah merampungkan pembangunan Ngoro Industrial Park tahap kedua di Kabupaten Mojokerto, Jawa Timur. Seluruh unit properti komersial pada lahan seluas 240 ha tersebut laku terjual. Intiland kini dikabarkan menyiapkan pengembangan Ngoro Industrial Park tahap ketiga dengan mengakusisi lahan seluas 700 ha senilai Rp300 miliar.

AKR Berminat Ikut Tender Solar 1,5 Jt KL PLN
PT AKR Corporindo berminat mengikuti tender suplai HSD (Solar) 1,5 juta kilo liter (KL) untuk beberapa pembangkit milik PT PLN (Persero).

Ciputra Tunjuk 3 Kontraktor Bangun Ciputra World Jakarta
PT Ciputra Property Tbk (CTRP) resmi menunjuk tiga joint operation sebagai kontraktor utama pembangunan mega proyek Ciputra World Jakarta dengan kontrak Rp1,055 triliun.

  Total Gaet Kontrak Senilai Rp 650 Miliar di Kuartal I 2010
Total optimistis bisa membukukan kontrak senilai Rp 3,5 triliun tahun ini.

  Pertamina Beli Saham Induk Usaha Medco?
Kabarnya, Pertamina sejak dua tahun lalu mengincar kepemilikan saham di MEDC.

  Potensi Bearish
Sepekan lalu, investor asing membukukan penjualan bersih Rp 1,77 triliun.

Indonesian Economy Expands at Fastest Pace Since 2008
(Bloomberg) -- Indonesia’s economy grew at the fastest pace in more than a year last quarter as record-low interest rates boosted consumer spending and exports and investment recovered.
http://www.bloomberg.com/apps/news?pid=newsarchive&sid=as.2gQk2ke38

EU Crafts $962 Billion Show of Force to Halt Euro Crisis
(Bloomberg) -- European policy makers unveiled an unprecedented loan package worth almost $1 trillion and a program of bond purchases as they spearheaded a global drive to stop a sovereign-debt crisis that threatened to shatter confidence in the euro.
http://www.bloomberg.com/apps/news?pid=20601087&sid=aeHrwqUq9G9A&pos=1

China Stocks RSI Signals Buy After Plunge: Technical Analysis
(Bloomberg) -- China’s stock market is poised to rebound from eight-month lows as a momentum indicator signaled the shares were oversold, according to Nomura Holdings Inc. and DMG & Partners Securities.
http://www.bloomberg.com/apps/news?pid=newsarchive&sid=aKujfIER8IwU

MSCI Asian Gauge May Retreat 18%: Technical Analysis (Bloomberg) -- The MSCI Asia Pacific Index may fall as much as 18 percent from yesterday’s close of 119.85 after falling through its 200-day moving average today, according to BGC Partners.
http://www.bloomberg.com/apps/news?pid=newsarchive&sid=ahnd8AxmwlXc

China’s Stocks Have ‘Corrected Enough,’ BofA Says (Update1)
(Bloomberg) -- China’s stocks have “corrected enough” and investors should consider buying equities as the probability of a hard landing for the economy is “not that high,” according to BofA Merrill Lynch Global Research.
http://www.bloomberg.com/apps/news?pid=newsarchive&sid=a.GObt21apU4

EU Bailout a 'Double-Edged Sword ': Strategist
Federal Reserve Chairman Ben Bernanke is widely acknowledged as an expert on the Great Depression and the policy errors that led to it that intensified the economic and social misery. 
http://www.cnbc.com/id/37012541

Bull Market Signaled by Oil Stocks at 19 Times Profit (Update1)
(Bloomberg) -- Investors in oil shares are more bullish on the U.S. economy than any time in the last eight years, convinced the biggest decline in equities since the bull market began will prove a buying opportunity.
http://www.bloomberg.com/apps/news?pid=newsarchive&sid=ahL7.Sh3aHpI

Bull Market Socked by Sovereign Woes
In theory, riots in Athens shouldn't cause the Dow to plunge. But the European debt crisis is undermining two, near-canonical assumptions that have come to underpin markets.
http://finance.yahoo.com/banking-budgetingk/article/109475/bull-market-socked-by-sovereign-woes;_ylt=Ah251HNkWz37zJS6_D_k3CW7YWsA;_ylu=X3oDMTFhMWd1dWVhBHBvcwM0BHNlYwNwZXJzb25hbEZpbmFuY2UEc2xrA3RoZXJlYWx0aHJlYQ--?mod=bb-budgeting

Why a Rising Unemployment Rate is Good News
It sounds dreadful. After drifting down consistently since last fall, the unemployment rate has suddenly shot up again, from 9.7 percent in March to 9.9 percent in April. But don't despair: A rising unemployment rate is actually one of the best signs yet that the economy is bouncing back.
http://finance.yahoo.com/news/Why-a-Rising-Unemployment-usnews-341062548.html;_ylt=AkVn8pv1tbhPoFksIbwQb6K7YWsA;_ylu=X3oDMTFhcHVxcDJkBHBvcwMzBHNlYwNzcGVjaWFsRmVhdHVyZXMEc2xrA3doeXJpc2luZ3VuZQ--?x=0

Why an Extended Bear Market is Likely
It now appears the 14-month old bull market that so many analysts, mutual fund managers, investors and Wall Street types said would perpetually continue, has changed its mind. In fact it appears, all along it was never really a new bull market, but a bear market rally cloaked in sheep's clothing.
http://finance.yahoo.com/news/Why-an-Extended-Bear-Market-etfguide-702986177.html;_ylt=AoUDg4IJeR.gpbK4ykgAYLG7YWsA;_ylu=X3oDMTFhZ2hzdnY4BHBvcwM4BHNlYwNzcGVjaWFsRmVhdHVyZXMEc2xrA3doeWFuZXh0ZW5kZQ--?x=0

Sumber: Bloomberg, inilah.com, kontan, detikfinance.com

Hold Buy 2.823 target 2.880/2.900, trailing stop 20p

Hold Buy 2700/2.720 &amp: closed at 2.790 (failed breakout 2.800 resistance in 30 minutes after open).
Entry market 2.690-2.710 & 2.750 stop 20p, target 2.822, buy breakout 2.823 target 2.880, stop 20p

Sunday, May 9, 2010

Rekomendasi & Strategy Top 24 Saham & IHSG

Closed sell 2800, 2746, 2720 at 2720. Profit +80p; +26p; +0p; +28p (closed buy 2.780).
IHSG menunjukkan signal three black crows (potensi reversal), tembus 20/50 MA, dan mendekati 100 MA di 2.690, bottomed di 2650/2.696, berpeluang mengkonfirmasi koreksi abc dalam 5/A telah berakhir, setelah gagal breakout 2.822, untuk target 2.822/2.910 (koreksi 10% dari record high) untuk mengantisiasi wave abc dalam B. Buy on runaway gap at open/on weakness sesi 1 (10/05): B7; pgas, medc, bbri, tlkm, smra, bksl, asii, unvr, bhit, bmtr, ggrm, doid, dild, smar, hmsp, bsde, ctra. Hold Buy 2700/2.720 & buy 2.650 target 2880 stop 2620. Risk 3.5%,Reward >10%.
Track Record IHSG: 25 Recommendations (19 profits: 2 break even: 4 loss) = (+20p+45p+73p+53+60p+45p+63p+0p+27p+50p-20p+13p
+40p+45p+40p+29p-30p-154p-75p+
80p+26p+0p+28p
). Total : 737 point - 259 point = Net +478 points = Average 19.12 point.

Update Daily Investment News

Look Ahead: Europe's Weekend Will Determine Wall Street's Week
http://www.cnbc.com/id/37038334

Retail Sales Probably Increased in April: U.S. Economy Preview
http://www.bloomberg.com/apps/news?pid=20601087&sid=aHmZ4skEFumk&pos=5

EU Finance Ministers Race to Ready Euro Fund Before Asia Opens
http://www.bloomberg.com/apps/news?pid=20601087&sid=a46uNVxfKbAw&pos=1

Smart Money Betting More Downside To Come
http://www.cnbc.com/id/37027003

Cramer: Don’t Buy Till Dow 9,000
http://www.cnbc.com/id/37020020

Volatility at Highest Level in 13 Months
http://www.cnbc.com/id/37019510

Halftime: 10% Stock Slide, Signals End Or Beginning?
http://www.cnbc.com/id/37019501

Top 16: When the worst are over??? Be Prepared: Short Term Bearish vs Med-Term Bullish

Weekly Fundamental & Technical Outlook for Energies and Metals - A Disastrous Week for Commodities

Elliott Wave: 3 Ways to Be Prepared for the Next Drop in the Markets

Nothing shakes up your day quite as much as watching the Dow drop straight down 998 points (9.2%) on the computer screen. It gives you that horrible sinking feeling that something big is happening that you might not be prepared for. As Tony sang in the Broadway musical, West Side Story:
Something's coming,
Don't know when
But it's soon…
http://www.elliottwave.com/freeupdates/archives/2010/05/06/3-Ways-to-Be-Prepared-for-the-Next-Drop-in-the-Markets.aspx

The Afternoon When Traders Couldn't Trade
Watching the Dow plummet on May 6, I couldn't help but remember Dusty Springfield singing, "Mama said there'll be days like this, There'll be days like this, my Mama said." Some EWI subscribers also couldn't help but remember what Bob Prechter wrote in Conquer the Crash about days like this when markets panic and trades don't go through:
http://www.elliottwave.com/freeupdates/archives/2010/05/07/The-Afternoon-When-Traders-Couldn-t-Trade.aspx

One Year Later: Is The Bear Really Dead?
The optimistic extreme we've been waiting for has finally arrived
http://www.elliottwave.com/freeupdates/archives/2010/05/03/One-Year-Later-Is-The-Bear-Really-Dead.aspx

Kalender Ekonomi & Event


Live Economic Calendar Powered by Forexpros - The Leading Financial Portal